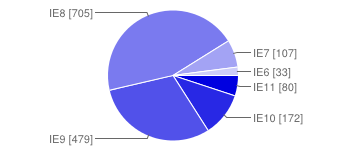

I wanted to know which IE versions my readers test on, so I held a survey. The results are below.
Last week I restarted my browser testing, after far too many months of working on the book. I wrote a bunch of new tests, but also wen over my browser test arrays once again. I’m getting tired of old IEs, so I considered removing data for IE7 and below from the desktop tables.
Before doing that, I wanted to make sure this aligns with the interests of my audience. So I created a survey and asked two questions:
IE8 is clearly the new baseline. 45% of respondents indicated that IE8 is the lowest version they test their projects in. 30% is on IE9; 16% on IE10 or 11; and 9% on IE6 or 7. So IE8 should definitely stay in my tables. I never doubted that, but it’s good to have the data to back me up.
Meanwhile I’ve taken my decision; partly based on the survey results, and partly based on the fact IE7 doesn’t run the latest version of my test harness.
I will cease testing in IE7 and below. However, I will keep historical data for these browsers around in a single "IE7 and lower" column.
This only really goes wrong with new tests: if IE8 supports a method or property I never tested before I have to guess if IE7 and lower also support it. In general I assume they support the Microsoft-invented properties, but for others I will occasionally have to add a "Don’t know" entry. If IE8 does not support something I never tested before, I assume IE7 and lower also don’t support it.
Here are the raw data. First Google Drive’s nice graphic:

Then the data table:
| Baseline | Total | IE11 | IE10 | IE9 | IE8 | IE7 | IE6 | IE5.5- |
|---|---|---|---|---|---|---|---|---|
| IE6 | 33 (2%) | 28 (85%) | 3 (9%) | |||||
| IE7 | 107 (7%) | 73 (68%) | 30 (28%) | 1 (1%) | ||||
| IE8 | 705 (45%) | 381 (54%) | 218 (31%) | 80 (11%) | 3 (0%) | |||
| IE9 | 478 (30%) | 153 (32%) | 252 (53%) | 56 (12%) | 7 (1%) | 2 (0%) | ||
| IE10 | 172 (11%) | 54 (31%) | 53 (31%) | 43 (25%) | 10 (6%) | 8 (5%) | 1 (1%) | |
| IE11 | 80 (5%) | 24 (30%) | 19 (24%) | 13 (16%) | 22 (28%) | 2 (3%) | 0 (0%) | 0 (0%) |
How to read: Of all respondents, 705 (45%) test most of their projects in IE8. Of those 705 respondents, 218 (31%) tested in IE7 at least once in the past year.
The IE11-IE5.5 columns don’t add up to 100% because a few respondents were confused and reported, for instance, testing all their sites in IE9 but IE10 being the lowest IE they tested in at all.
There are a few bits of data that merit calling out:
Here are today’s actual IE usage stats, courtesy of StatCounter; IE as a whole stands at 21% of the desktop market (though other sources disagree on that):
This is the blog of Peter-Paul Koch, web developer, consultant, and trainer.
You can also follow
him on Twitter or Mastodon.
Atom
RSS
If you like this blog, why not donate a little bit of money to help me pay my bills?
Categories: